Reports
Welcome to the Reports for recruiter on HST Sira!
The Job Performance Analytics dashboard provides comprehensive insights into your job posting performance, application metrics, and recruitment effectiveness.
- Navigate to Reports.
 In this section, you can see Job performance analytics and reporting
Report Categories
Available Report Types
Job Performance - Track job posting effectiveness and conversion metrics
Recruiter Activity - Measure recruiter productivity and efficiency
Employer Overview - View employer engagement and platform performance
Subscription Revenue - Monitor billing, subscriptions, and revenue trends
Job Performance
Available Filters
Start Date: Select beginning date for analysis period End Date: Select ending date for analysis period
Employment Type: Filter by: Full-time, Part-time, Contract, etc.
Gender: Filter applications by gender distribution
Search Title: Search for specific job titles
Filter Actions
- Apply Filters - Execute filtering with selected criteria
- Clear - Reset all filters to default values
Key Performance Metrics
Summary Statistics
Total Jobs:- Number of jobs posted within filter period Total Applications:- Total number of applications received Total Hired:- Number of successful hires made In Review:- Applications currently under consideration Total Rejected:- Number of applications rejected
Performance Rates
Overall Hire Rate:- Percentage of applications that result in hires Overall Rejection Rate:- Percentage of applications rejected
Gender Distribution
- Male Applicants: Number of male applicants
- Male Percentage: Percentage of total applications from males
- Female Applicants: Number of female applicants
- Female Percentage: Percentage of total applications from females
Additional Metrics
Total Rejection Rate:- Comprehensive rejection percentage across all criteria Average Applications per Job:- Mean number of applications received per job posting
Job Performance Data Table
The main data table displays detailed performance for each job posting:
| Column | Description |
|---|---|
| Job Title | Name of the position |
| Employer | Company or department name |
| Male Applicants | Number of male that apply |
| female Applicants | Number of female that apply |
| Applications | Number of applications received |
| Conversion Rate | Application-to-view ratio |
| Status | Current job status (Active, Closed, etc.) |
| Date Posted | When the job was published |
Exporting and Reporting
Data Export
- Export table data to CSV/Excel formats
- Generate PDF reports for stakeholders
- Schedule automated report deliveries
Custom Reporting
- Create custom date range comparisons
- Filter by specific departments or locations
- Generate performance trend analysis
Recruiter Activity
- Navigate to Reports -> Recruiter Activity.

 In this section, you can see Recruiter Activity analytics and reporting
Available Filters
Start Date: Select beginning date for analysis period
End Date: Select ending date for analysis period
Select Recruiter - Choose specific recruiter or view all
Filter Actions
- Apply Filters - Execute filtering with selected criteria
- Clear - Reset all filters to default values
Key Performance Metrics
Summary Metrics
Total Recruiters - Count of currently active recruiters.
Applications Touched - Total number of applications updates.
Total Hires - Number of hired applicants
Stage Performance Visualization
Total Actions Chart:
- Bar chart showing activity volume per stage
- Hover Feature: Shows average time spent in each stage
Recruiter Activities Table
| Column | Description |
|---|---|
| Recruiter Name | Name of the recruiter |
| Recruiter’s registered email address | |
| Total Actions | Total activities performed by the recruiter in the system |
| Applications Touched | Number of applications updated |
Recruiter Efficiency Metrics
| Column | Description |
|---|---|
| Recruiter Name | Name of the recruiter |
| Total Hires | Number of candidates successfully hired |
| Hire Rate | Percentage of processed applications that resulted in hires |
| Applications Processed | Total number of applications handled by the recruiter |
Stage Performance Metrics
| Column | Description |
|---|---|
| Stage Name | Name of the workflow stage |
| Average Time in Stage | Average duration candidates spend in this stage |
| Total Actions | Total activities performed in this stage |
| Unique Recruiters | Number of recruiters who engaged with this stage |
| Average Actions per Recruiter | Average number of actions taken per recruiter in this stage |
Employer Overview
- Navigate to Reports -> Employer Overview.
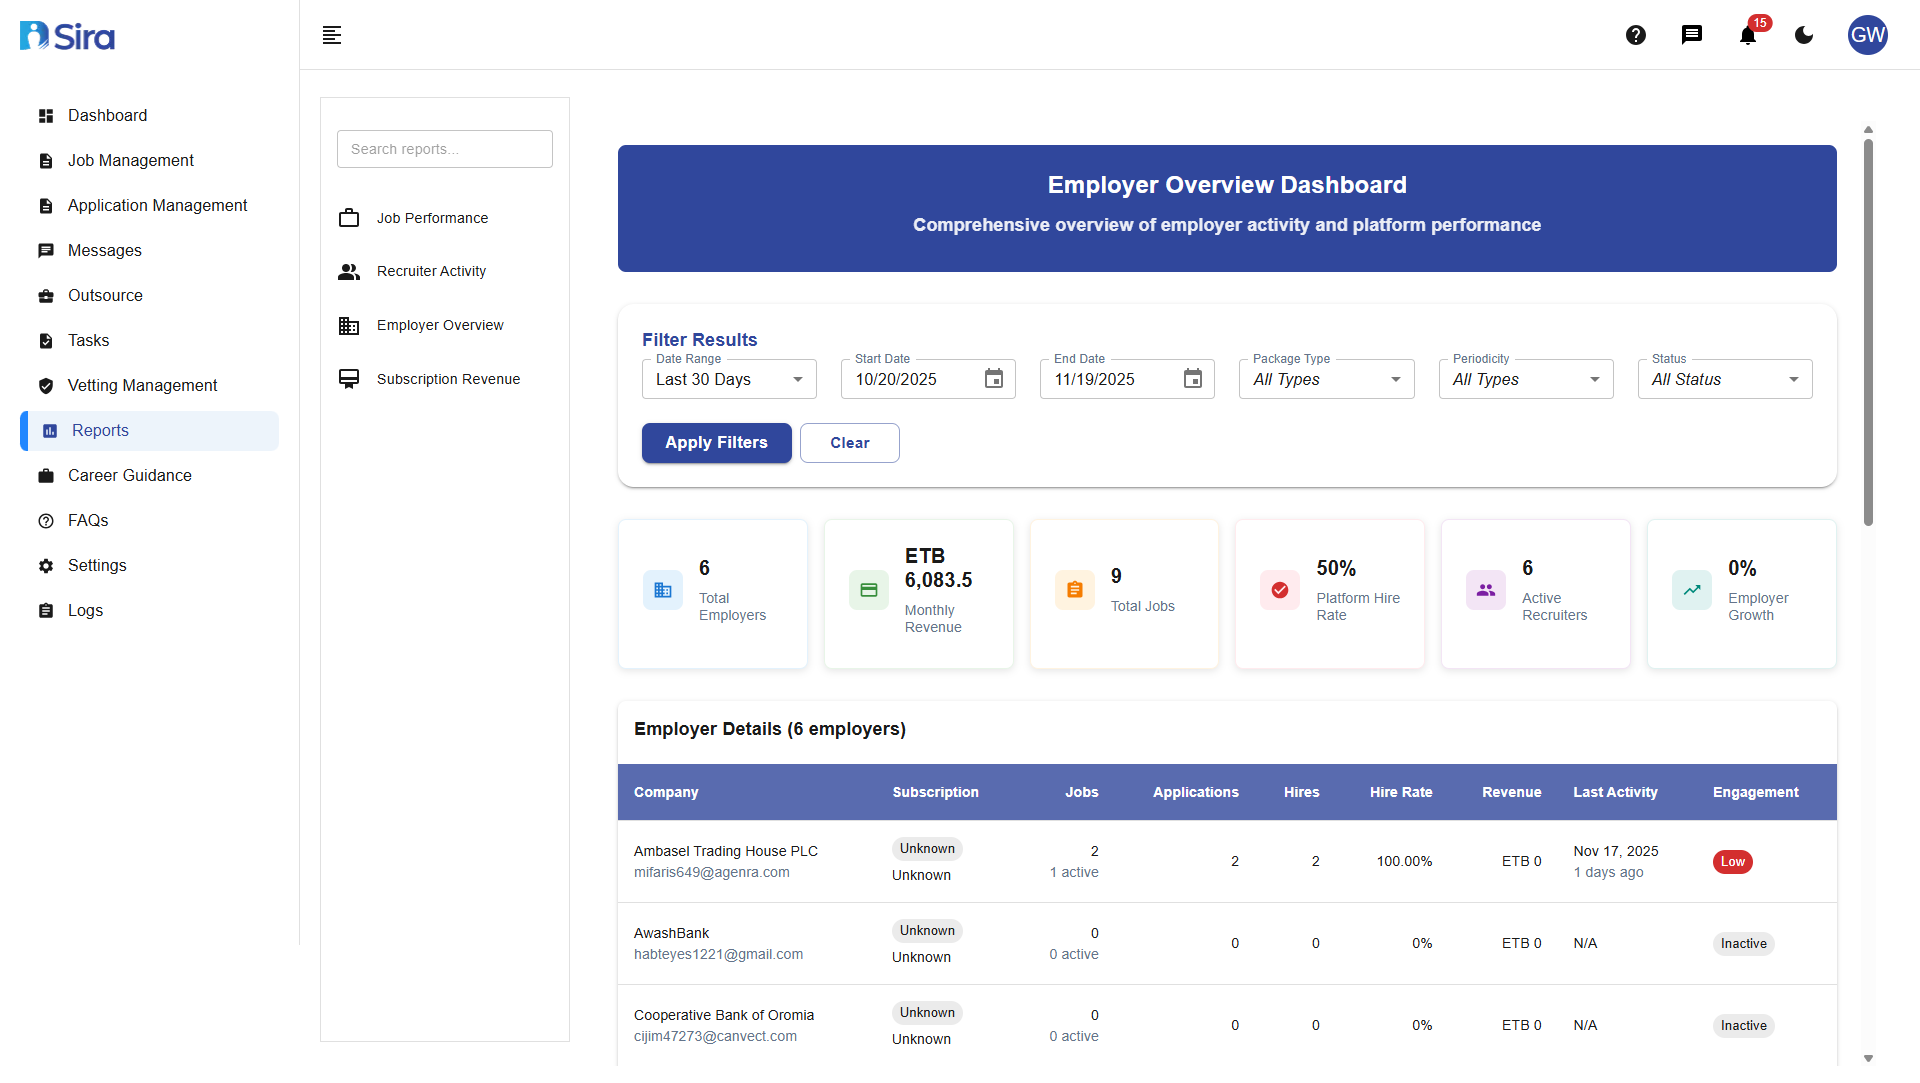
 In this section, you can see Employer Overview analytics and reporting
Available Filters
Start Date: Select beginning date for analysis period
End Date: Select ending date for analysis period
Select Package Type - Choose specific Package Type or All Types
Select Periodicity - Choose specific Periodicity or All Types
Select Status - Choose specific Status
Filter Actions
- Apply Filters - Execute filtering with selected criteria
- Clear - Reset all filters to default values
Key Metrics Dashboard
Summary Overview:
Total Employers - Total number of registered employers on the platform
Monthly Revenue - Total revenue generated in the current month
Total Jobs - Number of active job posted on the platform
Platform Hire Rate - Percentage of applications that result in successful hires
Active Recruiters - Number of recruiters currently active in the system
Employer Details Table
| Column | Description |
|---|---|
| Company & Contact Information | Basic employer details and primary contact info |
| Subscriptions | Current subscription plan and status |
| Jobs (Total & Active) | Total posted jobs and currently active listings |
| Applications | Number of applications received |
| Hires | Total successful hires made |
| Hire Rate | Percentage of applications converted to hires |
| Revenue | Total revenue generated from the employer |
| Last Activity | Most recent activity date on the platform |
| Engagement Score | Overall engagement rating based on platform interactions |
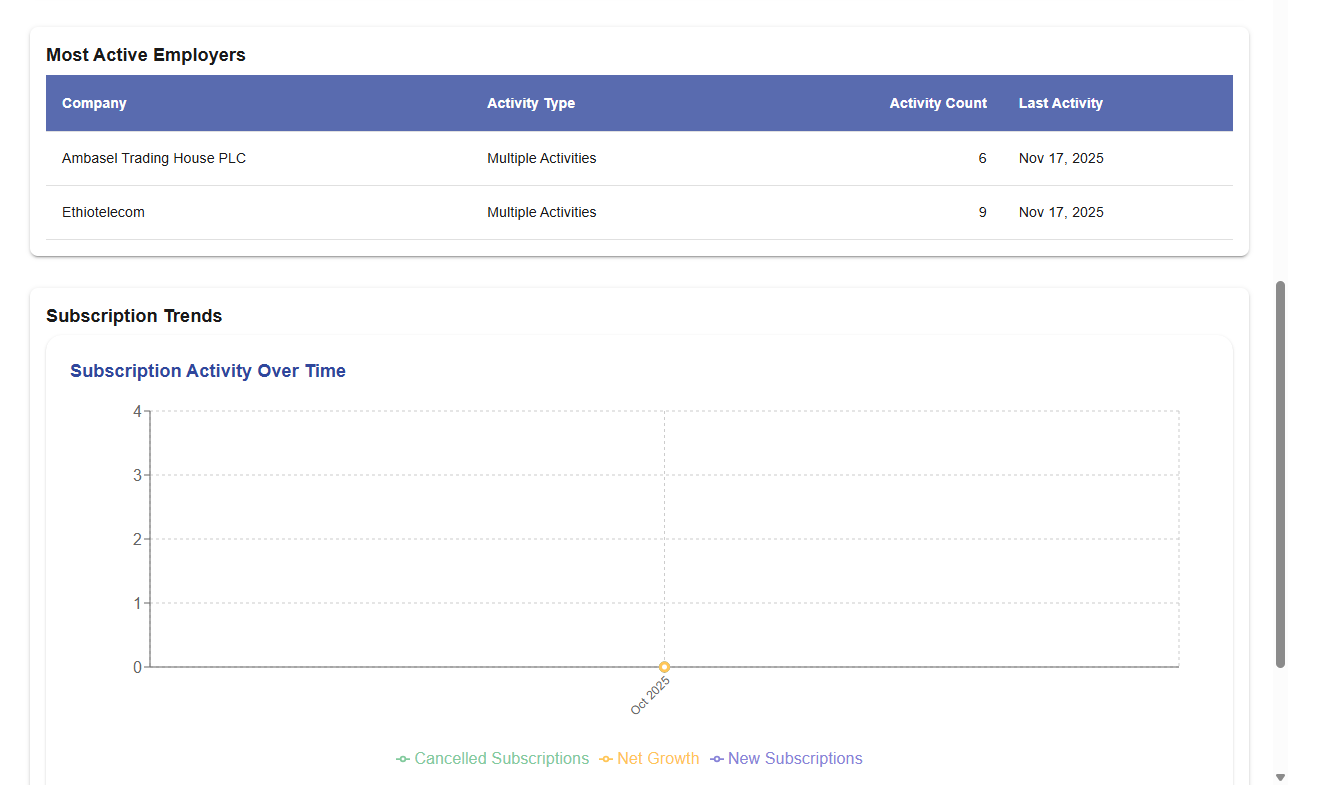
Most Active Employers Section
| Column | Description |
|---|---|
| Company Name | Name of the employer company |
| Activity Type | Type of action performed (e.g., job post, hire, update) |
| Activity Count | Number of occurrences for that activity type |
| Last Activity Date | Most recent date the activity occurred |
Subscription Trends
- Subscription Activity Over Time chart
- Metrics Tracked: - New Subscriptions
- Cancelled Subscriptions
- Net Growth
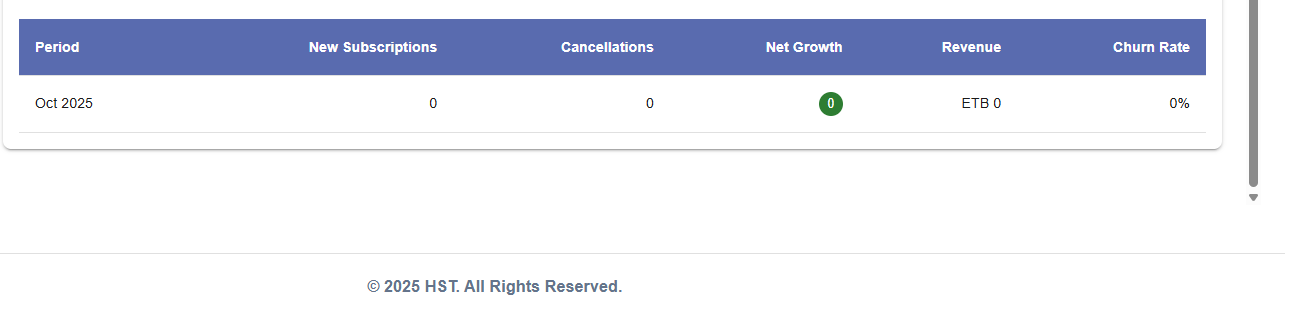
Monthly Breakdown
| Column | Description |
|---|---|
| Period | Monthly reporting timeframe |
| New Subscriptions | Number of newly added subscriptions |
| Cancellations | Number of subscriptions ended in the period |
| Net Growth | Growth calculated from new subscriptions minus cancellations |
| Revenue | Total revenue generated in the period |
| Churn Rate | Percentage of employer lost during the period |
Subscription Revenue
- Navigate to Reports -> Subscription Revenue.
 In this section, you can see Subscription Revenue analytics and reporting
Available Filters
Start Date: Select beginning date for analysis period
End Date: Select ending date for analysis period
Search Tenant - Filter by specific tenant
Filter Actions
- Apply Filters - Execute filtering with selected criteria
- Clear - Reset all filters to default values
Summary Overview
Total Subscriptions Active - Total number of active subscriptions.
Active- Count of currently active subscription orders.
Pending- Subscriptions awaiting confirmation or payment.
Failed- Subscriptions that were unsuccessful or declined.
Total Revenue - Total amount earned from all subscriptions.
Average Order Value - Average revenue generated per subscription order.
Total Service Fee - Total service fees collected from subscription payments.
Subscription Orders Table
| Column | Description |
|---|---|
| Tenant Name | Name of the Tenant |
| Plan Type | Subscription plan category (e.g., Basic, Standard, Premium) |
| Package Type | Specific package under the selected plan |
| Amount | Subscription payment amount |
| Service Fee | Fee charged for processing or service |
| Status | Current subscription status (active, pending, failed) |
| Order Date | Date the subscription was placed |
| Periodicity | Billing interval (monthly, yearly, etc.) |
Best Practices
Data Analysis Tips
- Use Filters Strategically - Narrow date ranges for specific insights
- Compare Periods - Analyze trends over different timeframes
- Monitor Key Metrics - Focus on hire rates and revenue indicators
- Identify Patterns - Look for seasonal trends or performance patterns
Troubleshooting
Common Issues
Missing Data:
- Verify date range includes active posting periods
- Check if filters are too restrictive
- Ensure job status is set to "Active" for current postings
Inconsistent Metrics:
- Allow 24-48 hours for data synchronization
- Verify tracking codes are properly implemented
- Check for duplicate job entries
Access Problems:
- Confirm user permissions for analytics access
- Verify subscription includes advanced analytics
- Contact support for access issues
Need Assistance?
- Contact customer support
- Refer to FAQs section for common questions
- Contact system admin for technical issues